

Reports
Organization Totals
Count observations by school, grade level, or content area, drill from a school into its grades and subjects, and export the counts to CSV.
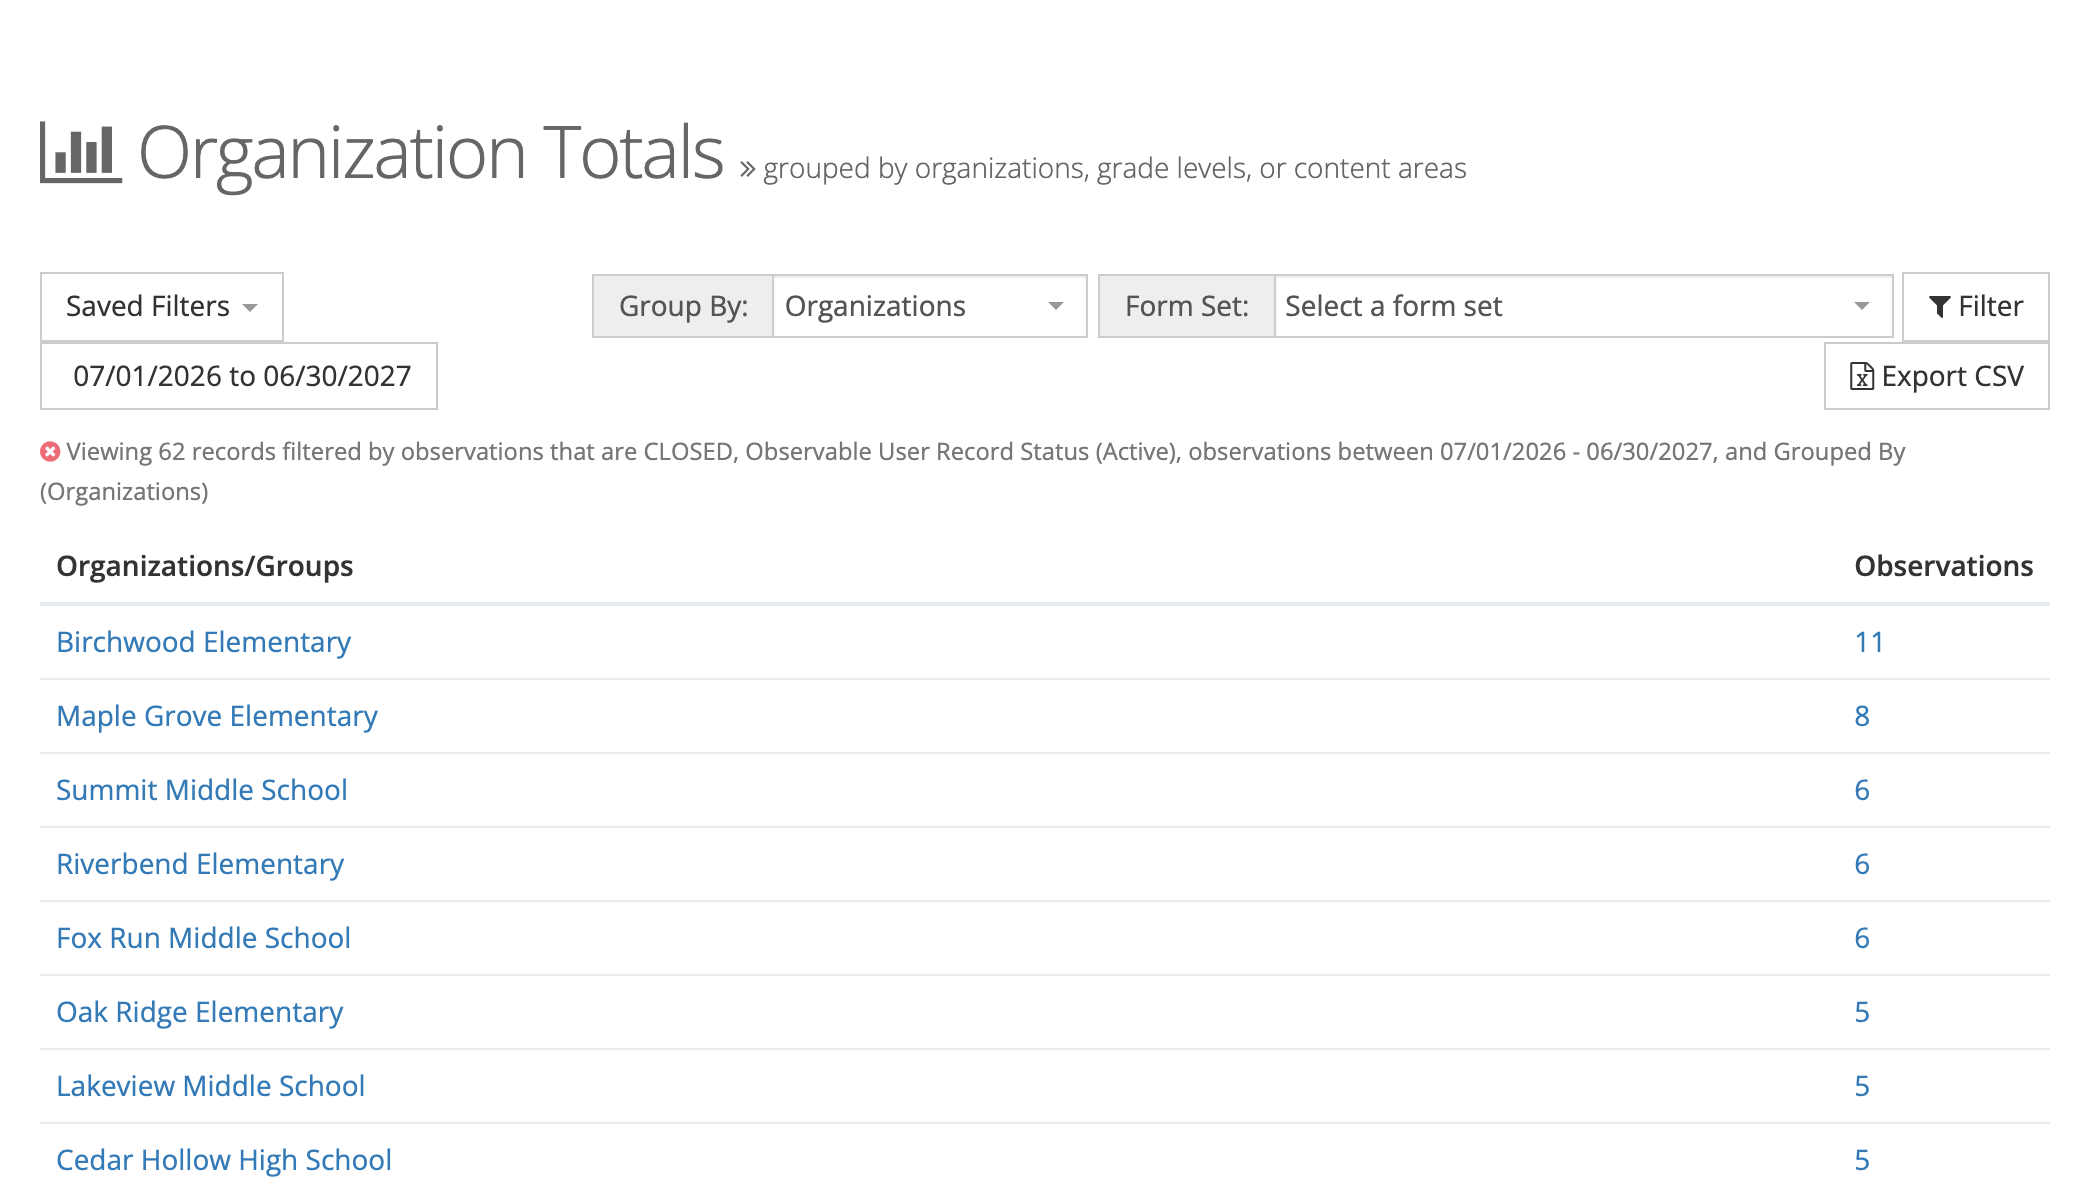
The Organization Totals report counts observations and groups the counts by organization, grade level, or content area. Use it to see where observation time is going: which schools are logging the most visits this year, or whether math classrooms are getting the same attention as reading.
Role: reporter, organization administrator, or system administrator. You see the organizations your role can reach.
Opening the report
Section titled “Opening the report”Go to Reports > Observation Reports and click Organization Totals. Administrators without the reporter role can open it from the Observe Dashboard.
The toolbar
Section titled “The toolbar”- Saved Filters: save the current filters under a name, or load one you saved before. See Saved Reports.
- Date range: defaults to the current school year. Pick a preset (Last 30 Days, Last 90 Days, This Month, This Quarter, Last Year, This Year) or set your own dates.
- Group By: Organizations (the default), Grade Levels, or Content Areas.
- Form Set: limit the counts to one form set. Leave it on Select a form set to count every form set.
- Filter: opens a Filters window (see below).
- Export CSV: downloads the rows for the grouping you are viewing.
Filters
Section titled “Filters”The Filters window has:
- Organizations: limit the report to certain schools.
- Grade Levels and Content Areas: limit the report to observations recorded with those values.
- Observation Status: Closed, Open, or both. The report starts on Closed, so open observations are left out until you add Open.
- Observable User Record Status: starts on Active, so observations of staff who have left are left out until you add their status.
The line above the table sums up the filters in use. Click the ✕ at its start to clear them.
Reading the table
Section titled “Reading the table”Each row is one organization, grade level, or content area, with its count of observations in the date range. Rows are sorted from the most observations to the fewest. Organizations with no observations still appear, at the bottom with 0.
Click a number to open those observations in All Observations, with the same filters applied. All Observations opens only for organization administrators, so this link works only if you hold that role.
Drilling down
Section titled “Drilling down”The names are links when the count is above zero:
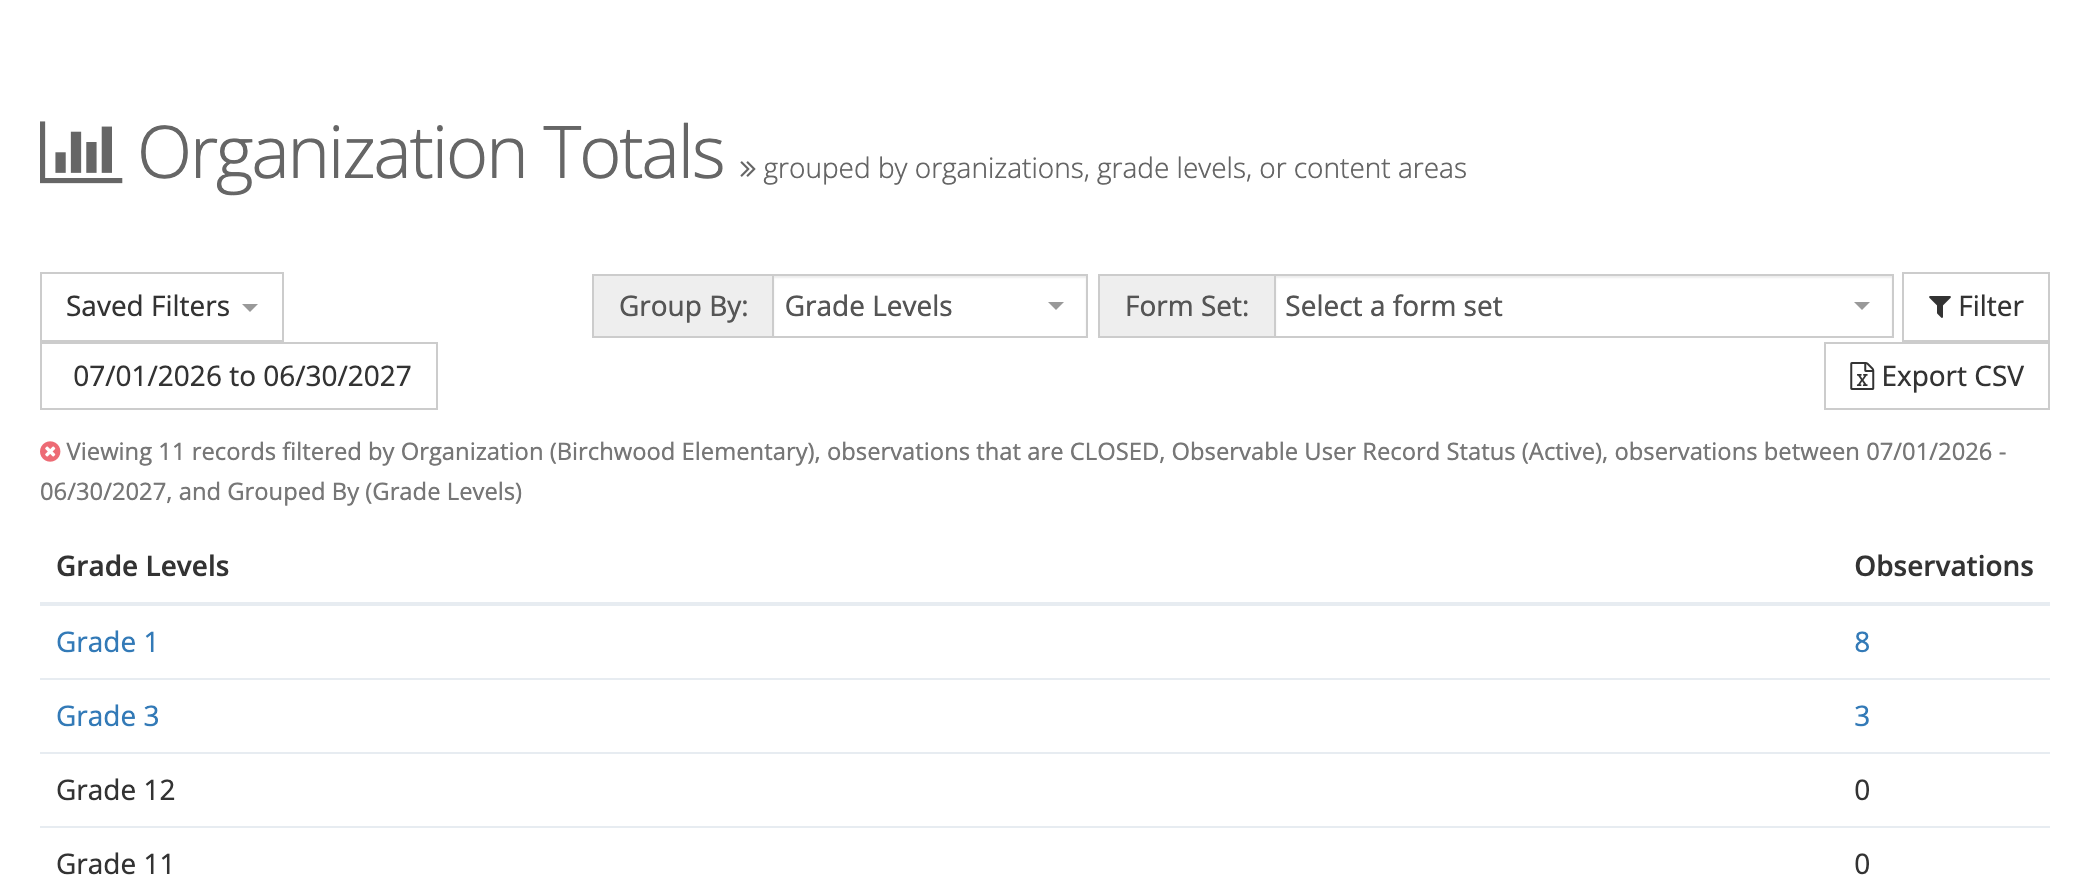
- Click a school’s name to see its observations by Grade Levels.
- Click a grade level to see that grade’s observations by Content Areas.
The report keeps the school or grade you clicked as a filter, and the filter line shows it.
Exporting
Section titled “Exporting”Click Export CSV. A progress window opens, and the file downloads when it is ready. The file matches the grouping and filters on the screen.
Organization Totals or Observable Users Totals?
Section titled “Organization Totals or Observable Users Totals?”Organization Totals counts observations where they were recorded, whatever has happened to the staff since. Observable Users Totals asks a different question: who on each school’s current roster has been observed, and who has not.