

Reports
Observable Users Totals
See how many of each school's current staff have been observed in a date range, list who has not, and export the list.
The Observable Users Totals report answers one question for each organization: of the staff on its roster today, who has been observed in this window, and who has been missed? Principals use it to make sure every teacher gets a visit before the end of a term, and district leaders use it to compare coverage across buildings.
Role: reporter, organization administrator, or system administrator. You see the organizations your role can reach.
Opening the report
Section titled “Opening the report”- Go to Reports > Observation Reports and click Observable Users Totals.
- From the Admin Dashboard, the Observable Users Totals link opens this report for the organization you are viewing.
- From the Observe Dashboard, the Coverage tile opens this report for the dashboard’s date range. When some teachers have not been observed at all, the coverage panel’s See who link opens it set to Users Not Observed, with the dashboard’s date range and schools carried over.
Click How to use this report in the upper right for a summary of the figures without leaving the page.
The cards at the top
Section titled “The cards at the top”- Organizations: the organizations in the report.
- Users to Observe: active staff who can be observed, counted once each.
- Users Observed: how many of them have at least one observation in the date range.
- Users Not Observed: the rest. This is the list to act on.
Users Observed and Users Not Observed show a dash until the table finishes loading. The cards follow the date range and the organizations you pick.
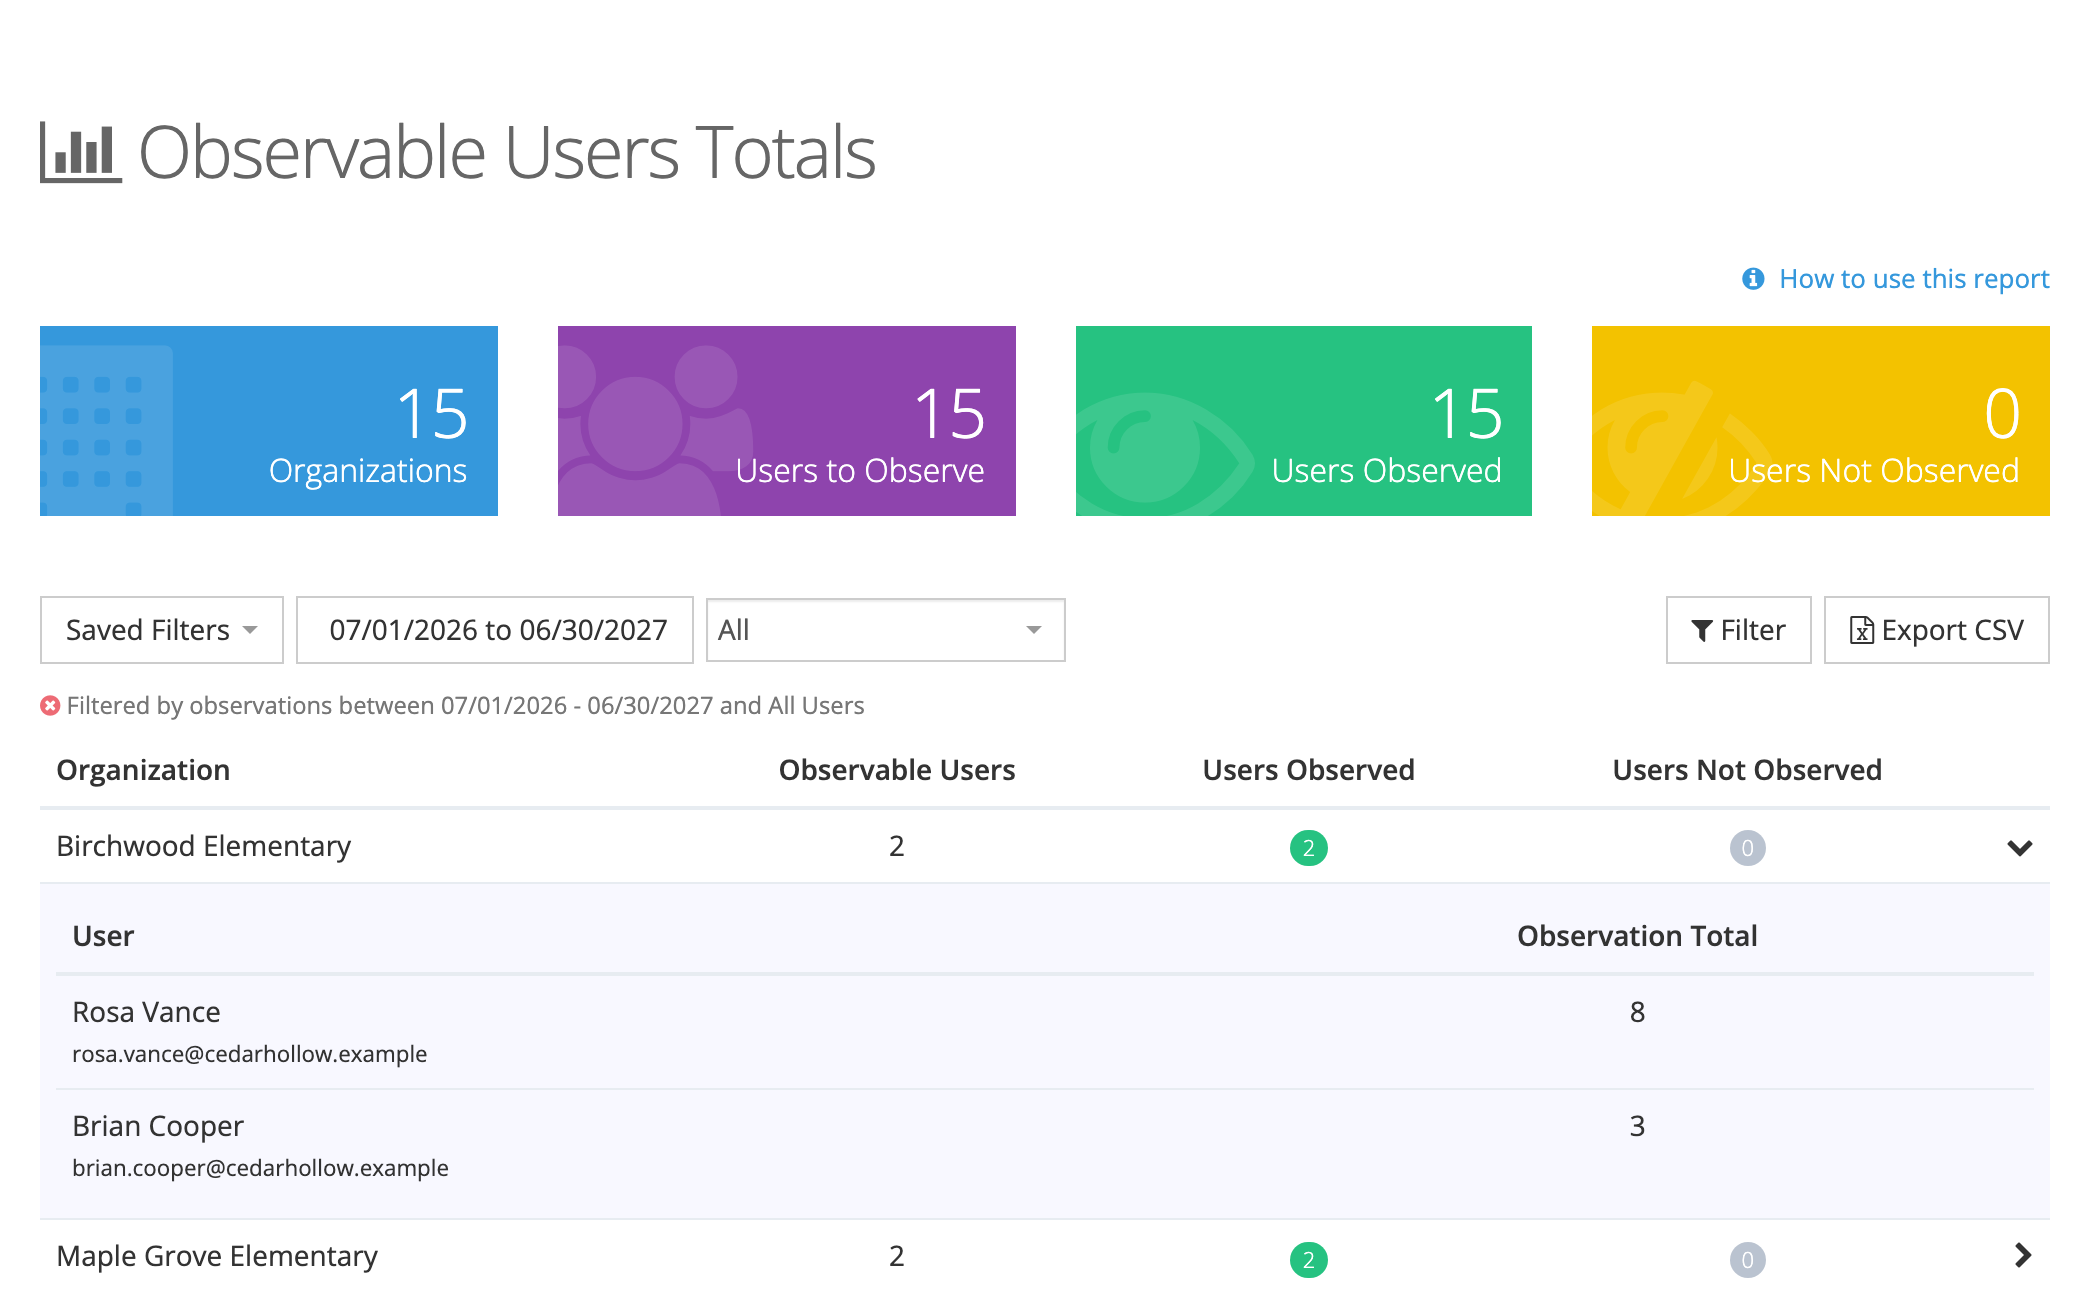
Narrowing the report
Section titled “Narrowing the report”- Saved Filters: save the current filters under a name, or load a saved one. See Saved Reports.
- Date range: defaults to the current school year. Pick a preset or set your own dates.
- All / Users Observed / Users Not Observed: show everyone, only staff who were observed, or only staff who were missed. This choice also changes the table’s columns and what Export CSV produces.
- Filter: opens a Filters window where you pick one or more Organizations.
The line above the table sums up the filters in use. Click the ✕ at its start to clear them.
Reading the table
Section titled “Reading the table”Each row is one organization:
- Observable Users: active observable staff who are members of the organization today.
- Users Observed: those members with at least one observation in the date range, recorded at this organization.
- Users Not Observed: the rest of its observable members.
With Users Observed or Users Not Observed chosen, the table shows only that column next to Observable Users.
Click the › at the end of a row to list the people behind the numbers, with each person’s Observation Total. Organizations with no one to observe show No observable users and sit at the bottom of the list.
How the counts work
Section titled “How the counts work”- Only closed observations count. An observation still waiting on a reflection, an acknowledgment, or closure has not landed yet, so a teacher can look unobserved while a walkthrough is in progress. If a number looks low near the end of a term, check for observations waiting to be closed.
- The roster is read as of today. A teacher who moved from School A to School B counts only at School B. Observations recorded at School A do not move with the teacher, so the teacher shows as not observed at School B until someone observes them there.
- Staff in more than one organization appear in each row they belong to. A teacher who sits in a school and in a department shows in both rows. The cards count each person once, so the rows can add up to more than the cards.
To count observations where they were recorded, whatever has happened to the staff since, use Organization Totals.
Exporting
Section titled “Exporting”Click Export CSV. The file follows the All / Users Observed / Users Not Observed choice:
- All: every observable person, with their observation count.
- Users Observed: only people with at least one observation in the date range.
- Users Not Observed: only people with none.
Each row has Organization, Last Name, First Name, Email, Status, and Observations. The export uses the date range and organizations on the screen. A progress window opens, and the file downloads when it is ready.