

weCLIMB
Dashboard
One screen showing where observations stand and what is waiting on whom, with every number linking to the records behind it.
The Observe Dashboard answers two questions on one screen: where do observations stand, and what is waiting on whom?
Use it for a weekly check: open it, see what has stalled, click through to the people involved, and follow up.
Role: System Administrator or Organization Administrator, on accounts with weCLIMB turned on. Administrators see the schools they have access to: a district-level administrator sees every school, and a building administrator sees their own. Counts that open the All Observations list work only for users who also hold the Organization Administrator role.
Opening the dashboard
Section titled “Opening the dashboard”Go to Dashboards > Observe Dashboard in the menu. If you have access to only one dashboard, it appears in the menu on its own instead of inside Dashboards.
To see what each panel means without leaving the page, click How to use this dashboard to the right of the page title.
The rules behind every panel
Section titled “The rules behind every panel”The filters drive everything. The date range and school filter at the top apply to every panel at once.
Dates bound completed work; unresolved work is shown as of today. An observation counts in the range it was carried out in. Anything still moving, such as a draft or a submitted observation waiting on a teacher, is shown as it stands today. A draft untouched since March is a problem now, so narrowing the date range never hides it.
Numbers open their rows. Click a linked count, bar, or row and you get the observations it counted, on a filtered All Observations list or the matching report. All Observations needs the Organization Administrator role, so a System Administrator without that role is turned away from those links (the report links still open).
Filtering
Section titled “Filtering”
Date range: defaults to the last 90 days. The presets are This School Year, Last School Year, Fall, Spring, Summer, and All Time, or enter a Start Date and End Date and click Apply.
Schools: All schools you can see, or a selection of buildings. The school filter narrows within what you can already see.
The panels
Section titled “The panels”Observation summary
Section titled “Observation summary”
Five figures across the top of the page:
- In flight: submitted observations not yet closed, split into those with observers and those with teachers.
- Observations: how many were submitted in the range, with the pace per active week beneath.
- Coverage: the share of teachers seen at least once, with “N of N teachers seen” beneath.
- Median time to close: how long an observation takes from the visit to closing, with the prior period for comparison. This figure is counted by when the observation closed, not when the visit happened, so slow closures that cross the end of the range still count.
- Written feedback: the share of submitted observations that carried a written remark.
In flight and Observations open a filtered list of observations. Coverage opens the Observable Users Totals report for the same dates.
Needs attention
Section titled “Needs attention”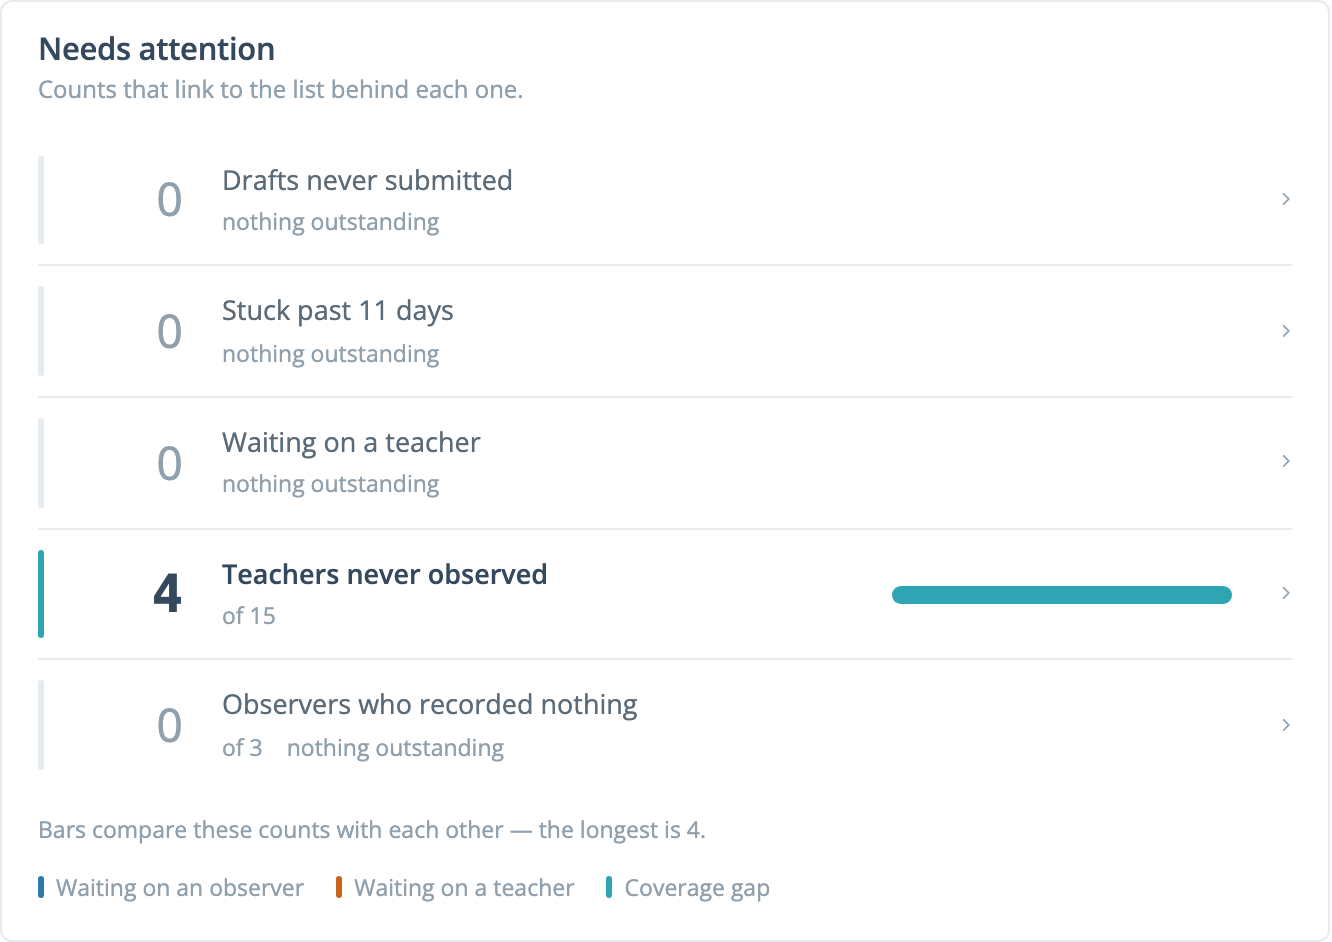
Counts of work to follow up on, in a fixed order:
- Drafts never submitted: observations started more than 30 days ago and never submitted.
- Stuck past 11 days: submitted observations that have sat in the same step for 11 days or more.
- Waiting on a teacher: observations where the next step belongs to the teacher.
- Teachers never observed: observable staff with no observation in the range.
- Observers who recorded nothing: observers in your schools who recorded no observation in the range.
A count appears only when it can apply to your account. Waiting on a teacher needs a form set that asks for reflection or acknowledgment. The last two need observable staff and observers in your schools.
Under each label you may see “of N” (the group the count is measured against) and “oldest Nd” (the age of the oldest item). The colored band on the left of each row says whose court the work is in:
- Blue: waiting on an observer
- Orange: waiting on a teacher
- Teal: a coverage gap
A count of zero stays on the list in grey, marked “nothing outstanding”, so you can tell it is zero and not missing. A bar beside each count above zero compares it with the others in the panel.
Click a row to open its list. Drafts, stuck work, and waiting-on-teacher open a filtered All Observations list with a matching title, such as Drafts Never Submitted. The two coverage rows open the matching report.
Participation
Section titled “Participation”How many of the observers who could observe recorded at least one observation in the range, plus four figures: Longest gap, Break weeks, Busiest day, and Per active week. Break weeks are detected across every school you can see, so one quiet building does not count as a district holiday.
Which teachers are being observed?
Section titled “Which teachers are being observed?”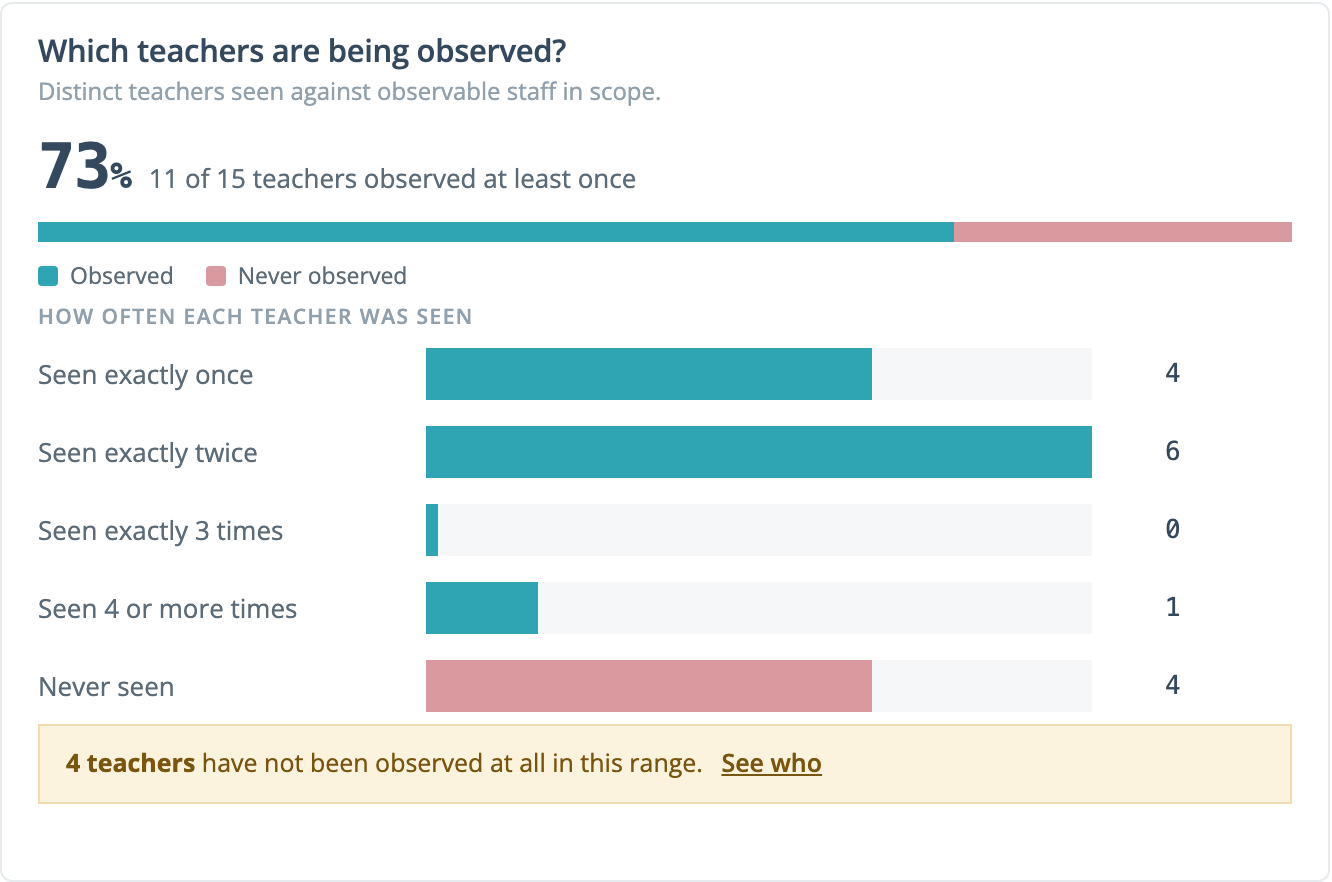
Distinct teachers seen, measured against everyone on the roster or observed during the range, so coverage cannot exceed 100%. If someone observed has since left the roster, a note says so.
The breakdown shows how many teachers were Seen exactly once, Seen exactly twice, Seen exactly 3 times, Seen 4 or more times, and Never seen. This is where repeat visits become visible: high coverage with most teachers in the four-or-more band means a small group is seen often. When some teachers were never observed, a note with a See who link opens the list.
Where observations land
Section titled “Where observations land”The busiest grades and content areas by volume, up to eight of each. Click a row to open the observations behind it.
A grade or content area with no observations in the range does not appear here. To find who has been missed, use Teachers never observed in Needs attention or the coverage panel.
Click Full breakdown by organization, grade, and content area to open the Organization Totals report with the same dates.
Observation volume
Section titled “Observation volume”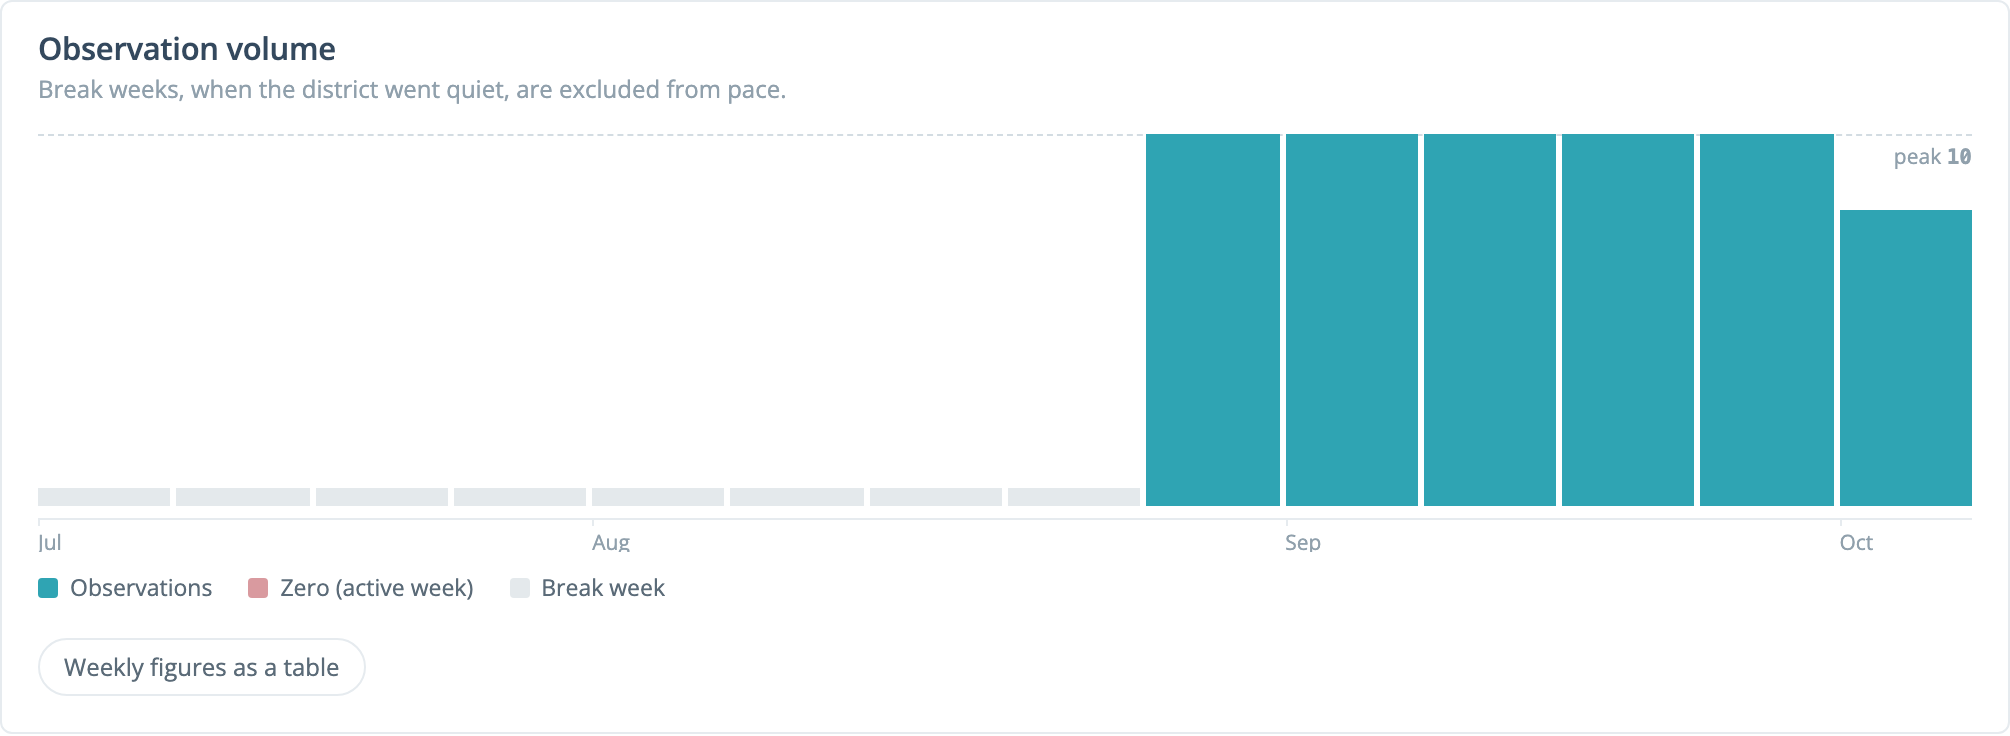
A bar per week, or per month when the range is too long for weekly bars.
Weeks when the whole district went quiet are break weeks: shaded grey and left out of the pace figure, so a holiday never reads as a decline. One observer going quiet is not a break; that belongs in Needs attention. A week with no observations that is not a break shows a short red bar.
Every bar with observations behind it opens the list for its week or month. So does every linked figure under Weekly figures as a table. Break weeks and weeks with nothing recorded have nothing to open.
Are observations substantive?
Section titled “Are observations substantive?”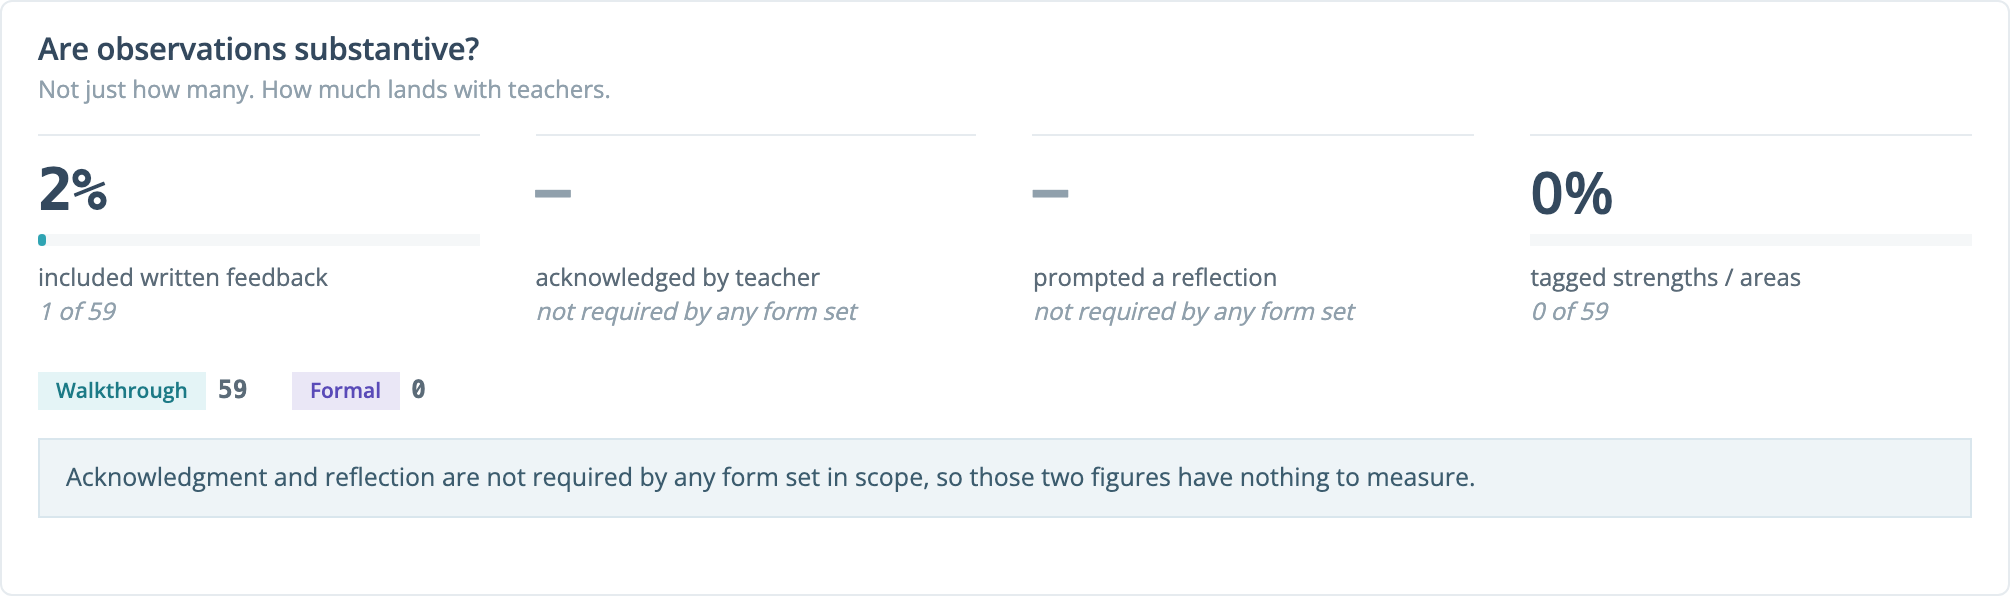
Not how many observations happened, but how much of each one reached the teacher:
- included written feedback: a written remark was recorded.
- acknowledged by teacher: the teacher acknowledged the observation.
- prompted a reflection: the teacher was asked to reflect and did.
- tagged strengths / areas: feedback template tags were applied.
Each figure is out of every submitted observation in the range, with the count underneath (for example, “1 of 59”). Acknowledgment and reflection are requested only when a form set asks for them, so measuring only those observations would let a small pilot read as a district-wide result. Showing the full count keeps the scale visible.
When a feature is not in use, the figure shows a dash instead of 0%, with “not required by any form set” or “no feedback templates defined” underneath. A figure above zero that rounds below one percent shows as <1%.
Below the four figures, the panel splits the range’s observations into Walkthrough and Formal.
A weekly routine
Section titled “A weekly routine”- Scan the summary strip. Is the pace where it should be for this point in the semester? Is work piling up in flight?
- Work the Needs attention list. Click the largest count and follow up on the observations behind it.
- Check coverage. If the percentage looks healthy but the visit breakdown is lopsided, some teachers are seen often while others wait.
- Check the volume chart for gaps. A run of low weeks that is not shaded as a break is a slowdown, not a holiday.
Common questions
Section titled “Common questions”A number on the dashboard doesn’t match a report.
Click the number. The list you land on is the population the dashboard counted, with the same dates and schools. If a report shows something different, check whether the report counts only closed observations or treats the roster differently.
Why does the current week look low?
It doesn’t count as a whole week. A week in progress contributes only the days that have happened, so the pace figure does not dip every Monday.
Nothing appears in a panel.
A panel with nothing to show says so, for example “No submitted observations in this range”, so you know it loaded and found nothing.
I can see the dashboard but a colleague cannot.
Check their roles. The dashboard needs System Administrator or Organization Administrator. To open the All Observations lists behind the counts, they also need Organization Administrator.
Related
Section titled “Related”- Observable Users Totals: coverage by organization, with a per-user breakdown.
- Observer Activity: one row per observer.
- Organization Totals: activity by organization, grade level, and content area.
- Managing Observations: the All Observations list the dashboard links open.