Administration
Admin Dashboard Overview
See observation and professional learning totals for the schools you administer, and jump to the reports behind them.
The Admin Dashboard gives a principal or district leader one view of how observations and professional learning are going in the organizations they run. In a few seconds you can see how many classrooms have been observed this year, which teachers have not been observed yet, which observations are still open, and how many courses staff have completed or have in progress.
Role requirement: organization_administrator. The dashboard covers the organizations you belong to as an administrator and everything beneath them. A system administrator sees the Admin Dashboard only if they also hold the organization administrator role; district-wide settings live in System Administration (the gear icon) instead.
Open the dashboard
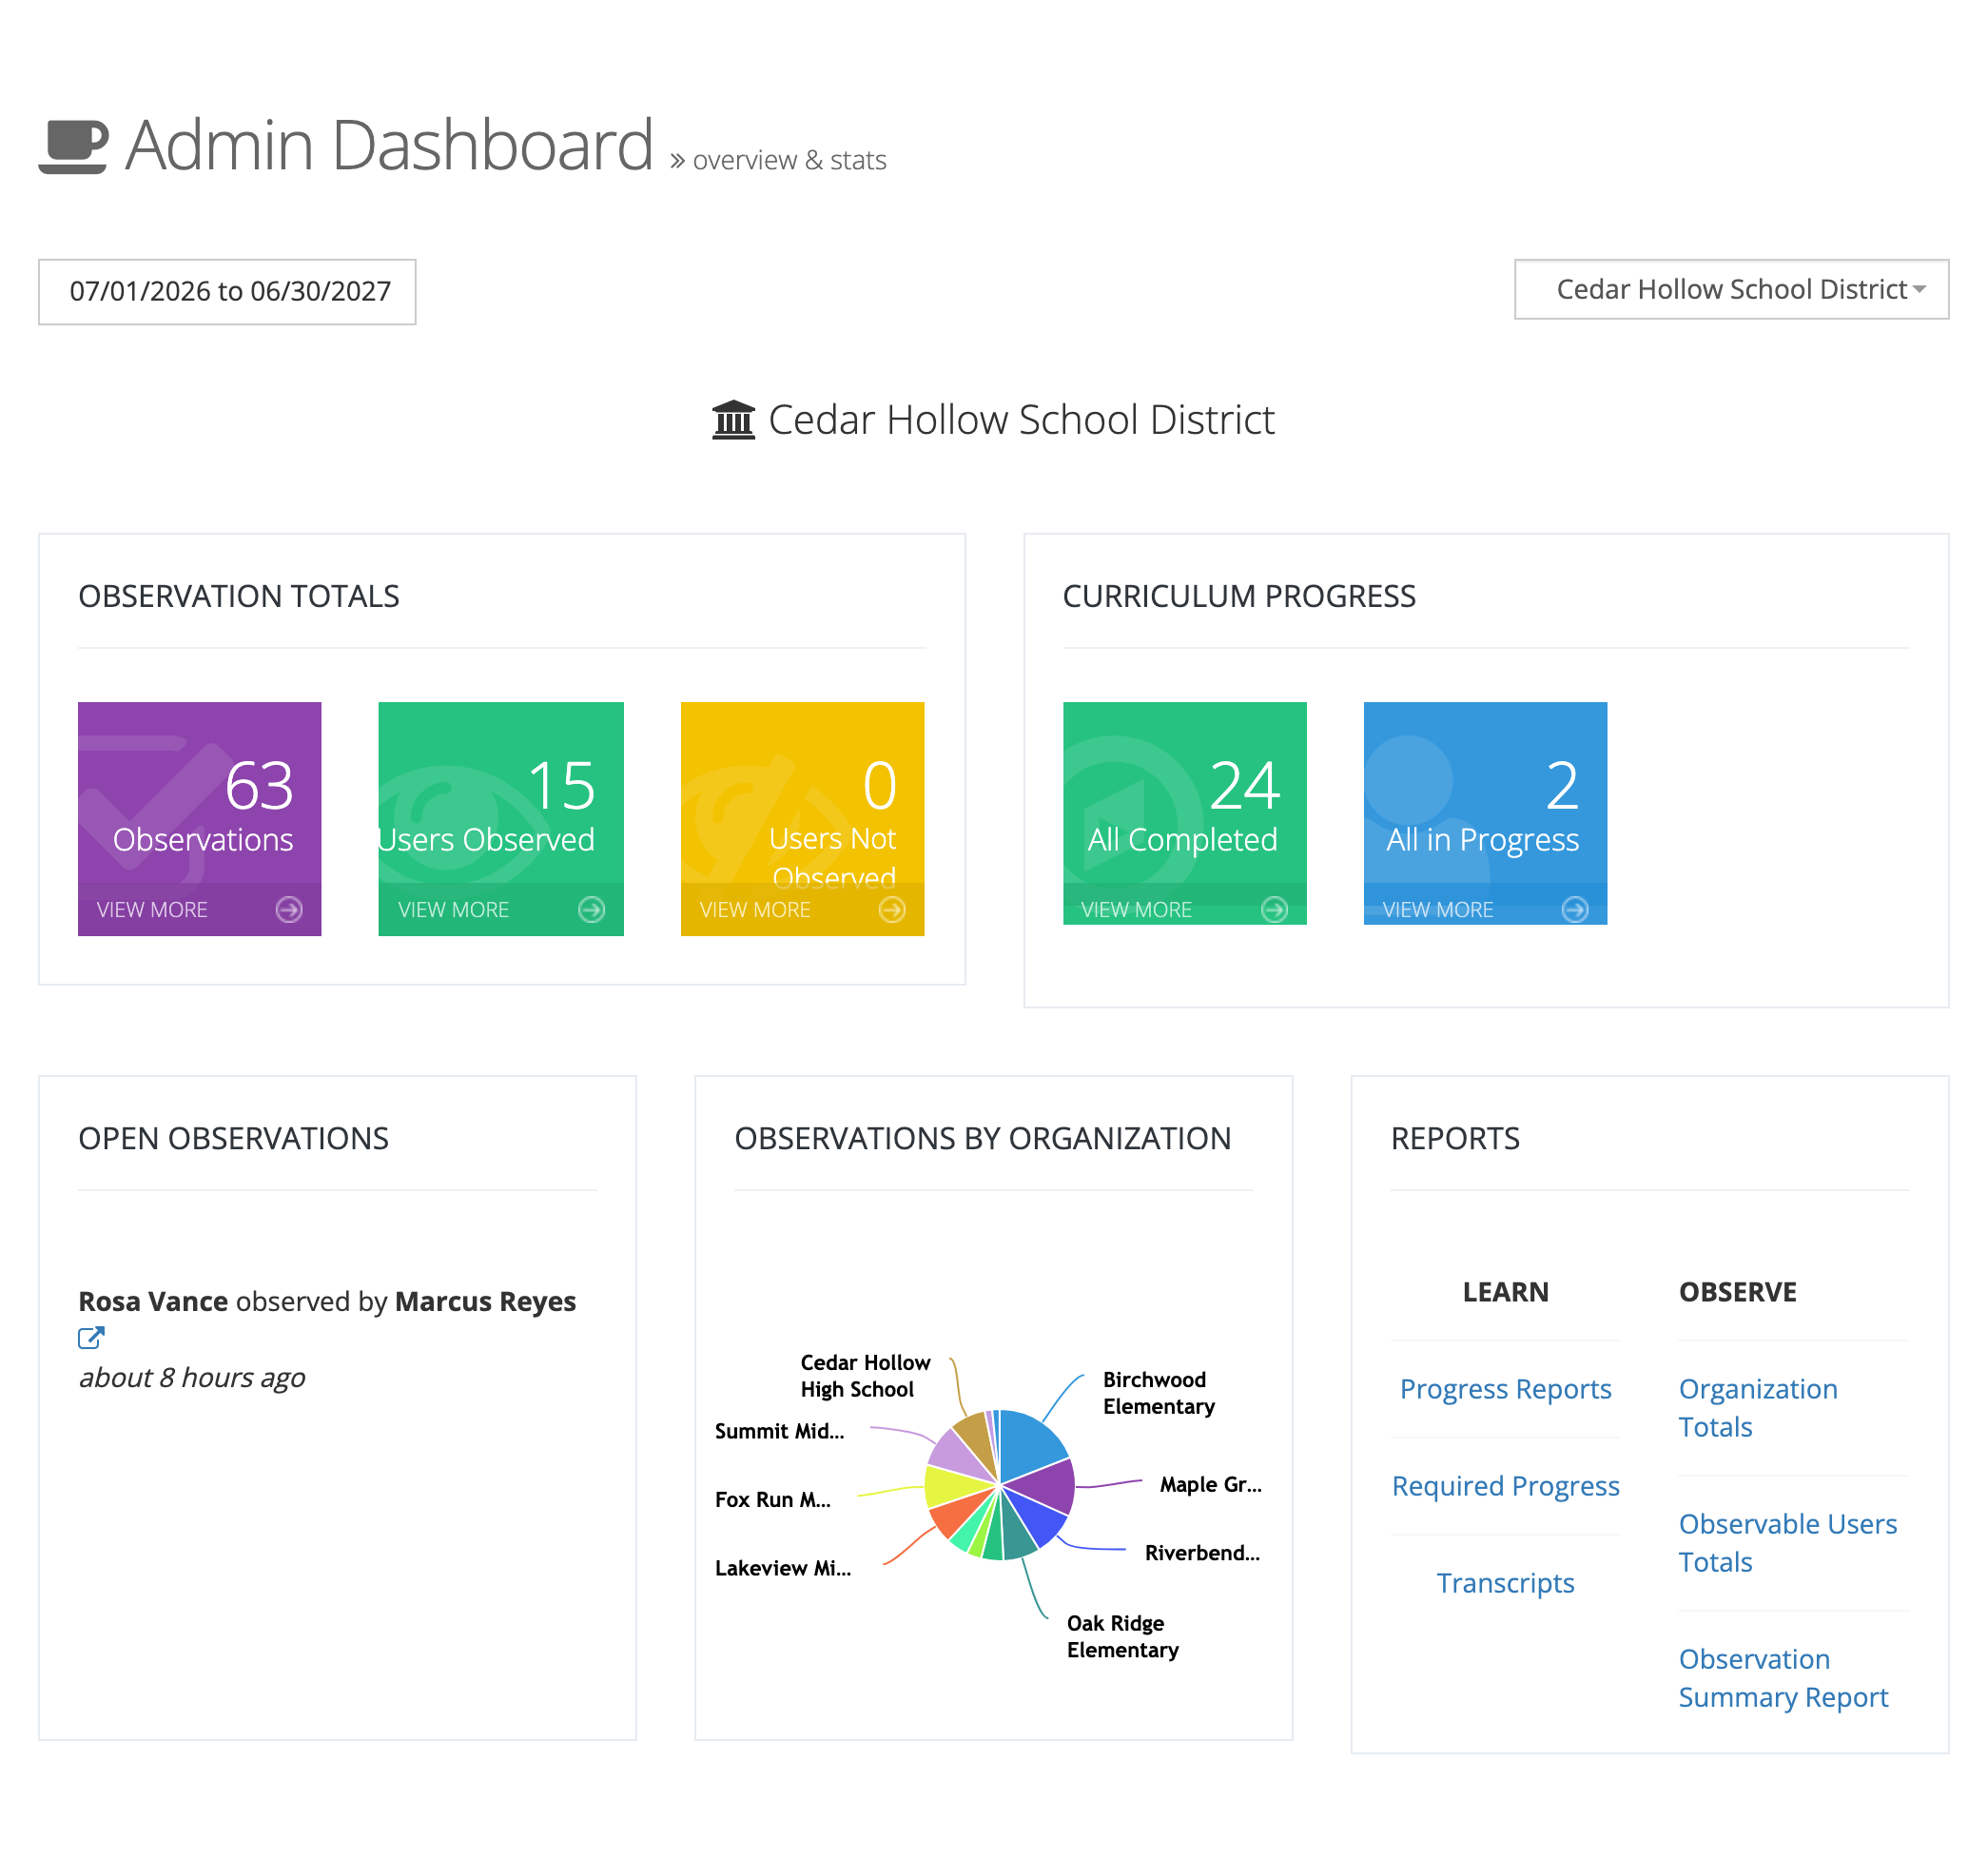
Section titled “Open the dashboard”In the My Home sidebar, open Dashboards and select Admin Dashboard. The page is titled Admin Dashboard (“overview & stats”).
Choose the date range and organization
Section titled “Choose the date range and organization”Two controls at the top decide what every card counts:
- Date range button: starts on the current school year. Choose Last 30 Days, Last 90 Days, This Month, This Quarter, Last Year, This Year, or All Time, or type a Start Date and End Date and select Apply.
- Organization picker: lists the organizations you administer and the schools and groups beneath them. The dashboard shows one organization at a time, including everything beneath it, and its name appears above the cards.
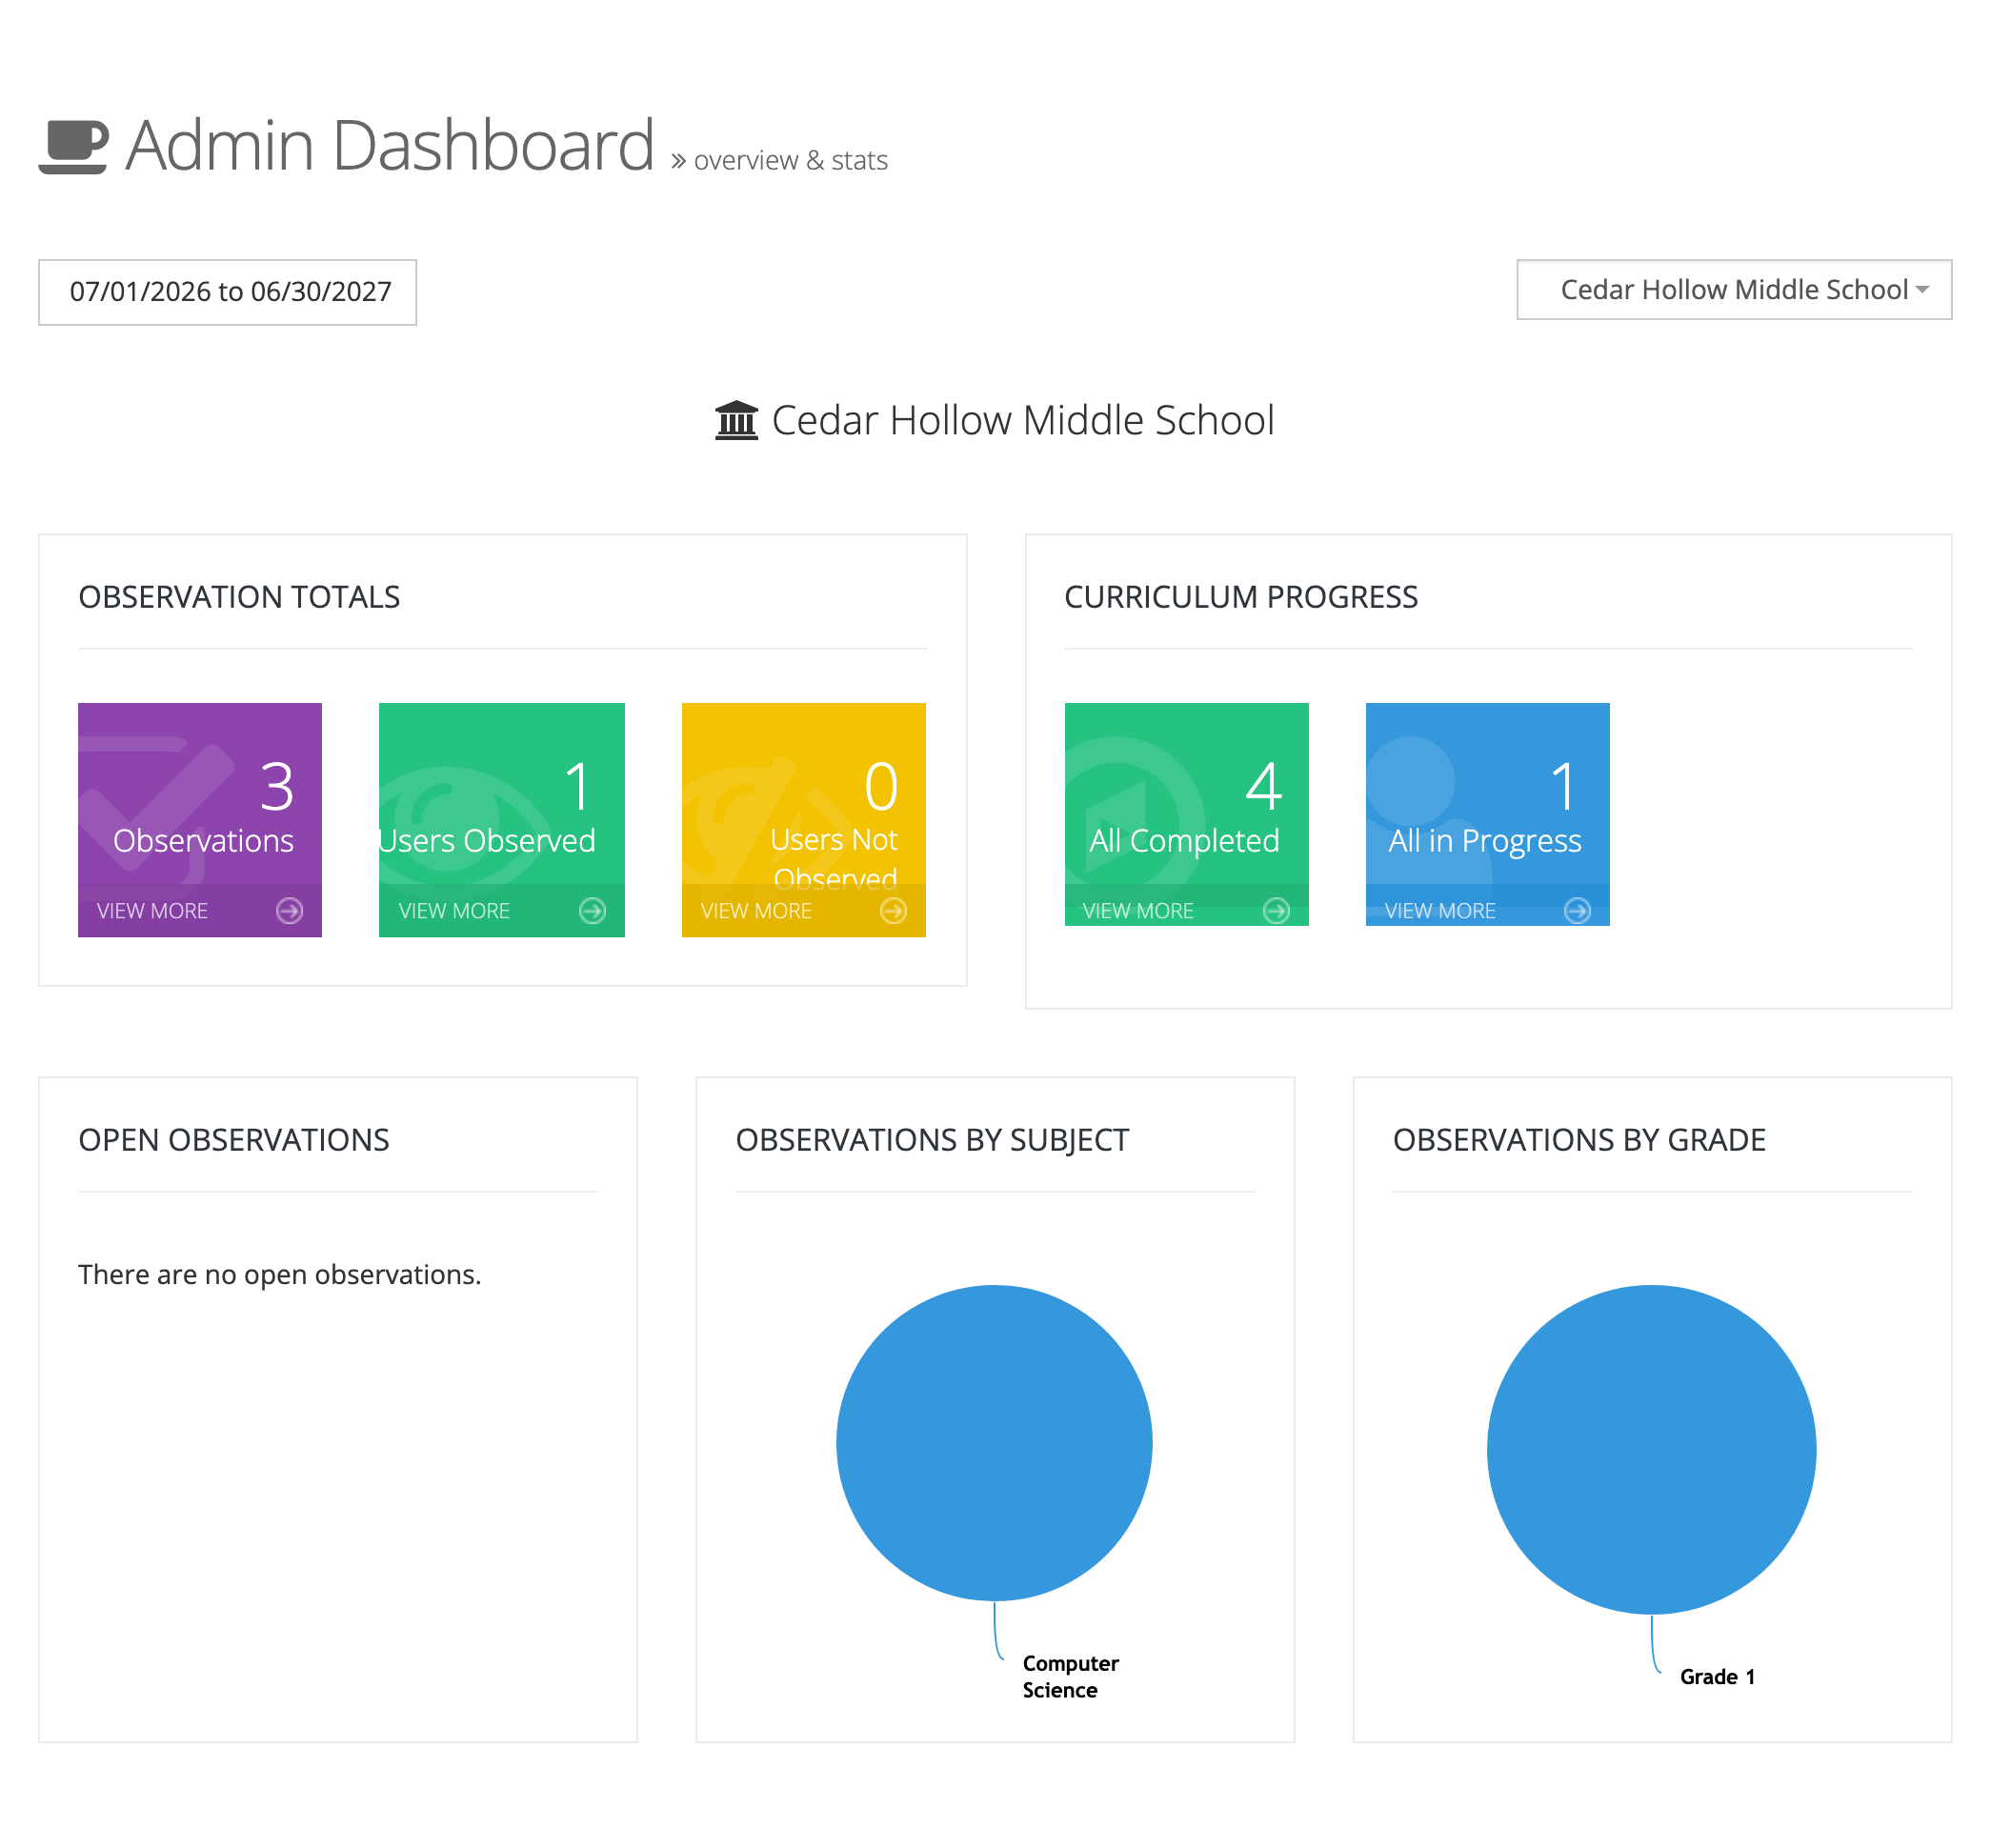
Which cards appear depends on two things: whether weCLIMB and eLearn are turned on for your district, and whether you are looking at the district or at a single school.
| Card | District | A school |
|---|---|---|
| OBSERVATION TOTALS | Yes | Yes |
| CURRICULUM PROGRESS | Yes | Yes |
| OPEN OBSERVATIONS | Yes | Yes |
| OBSERVATIONS BY ORGANIZATION | Yes | No |
| OBSERVATIONS BY SUBJECT and OBSERVATIONS BY GRADE | No | Yes |
| REPORTS | Yes | No |
The weCLIMB cards appear only when weCLIMB is on, and CURRICULUM PROGRESS only when eLearn is on.
OBSERVATION TOTALS
Section titled “OBSERVATION TOTALS”Three tiles, each counting closed observations in the date range. Observations still waiting on a reflection, an acknowledgment, or closing are not counted.
- Observations: the number of closed observations of active staff.
- Users Observed: observable staff with at least one closed observation.
- Users Not Observed: observable staff with none. Use this tile to find the teachers who still need a visit before an evaluation deadline.
View more on Observations opens the observation list for the organization, filtered to closed observations. On the other two tiles it opens the Observable Users Totals report, filtered to observed or not-observed staff.
CURRICULUM PROGRESS
Section titled “CURRICULUM PROGRESS”This card summarizes professional learning in eLearn.
- All Completed: the number of transcripts (completion records) for active staff, completed in the date range.
- All in Progress: the number of courses and assessments staff have started but not finished, counted by start date.
View more on All Completed opens the organization’s Transcripts report. On All in Progress it opens the organization’s progress report. Both are eLearn reports and require the reporter role; without it, the links do not open.
OPEN OBSERVATIONS
Section titled “OPEN OBSERVATIONS”Lists each observation that is still open, as “teacher observed by observer”, with how long ago it started. Select the link icon to open the observation. When nothing is open, the card reads “There are no open observations.”
Observation charts
Section titled “Observation charts”Pie charts break down closed observations in the date range:
- OBSERVATIONS BY ORGANIZATION (district view): one slice per school.
- OBSERVATIONS BY SUBJECT and OBSERVATIONS BY GRADE (school view): one slice per content area and per grade level.
A chart with no closed observations reads “There is no observation data.”
REPORTS
Section titled “REPORTS”On the district view, the REPORTS card links to the reports most leaders use. Most links carry over the organization and date range you chose; Required Progress opens the full report, unfiltered:
- Under LEARN: Progress Reports, Required Progress, and Transcripts. These require the reporter role.
- Under OBSERVE: Organization Totals, Observable Users Totals, and Observation Summary Report. When the organization has saved filters on those reports, a SAVED REPORTS heading lists one link per saved filter.
See Saving and Reusing Report Filters for how saved filters are created.
Where teachers’ own work appears
Section titled “Where teachers’ own work appears”The Admin Dashboard shows totals for the organizations you run. Your own observations, anything waiting on your reflection or acknowledgment, and your assigned courses appear on My Dashboard (My Home > Dashboards > My Dashboard). See Your Observations as a Teacher.