

Coaching
Growth Trajectory
Read one teacher's coaching cycle at a glance: visits per month, action-step completion, and how the focus areas shifted over time.
The Growth Trajectory page summarizes one coaching assignment: how often the coach visited, how many action steps the teacher followed through on, and which focus areas the work targeted month by month. Coaches use it to check their own visit rhythm and to ground a mid-year or end-of-cycle conversation in what happened, not in memory of the last visit.
The page only reads the assignment’s own visits and action steps. Nothing on it changes the coaching record.
Roles: the assigned coach, and system administrators and organization administrators who can open the assignment.
Open the page
Section titled “Open the page”- Open the assignment from Coaching > My Roster or Coaching > All Assignments.
- In the side panel, click View Growth Trajectory.
The breadcrumb leads back to the roster and to the assignment. Click How to use this page at the top right for a short in-app guide, Using the Growth Trajectory.
The summary line and tiles
Section titled “The summary line and tiles”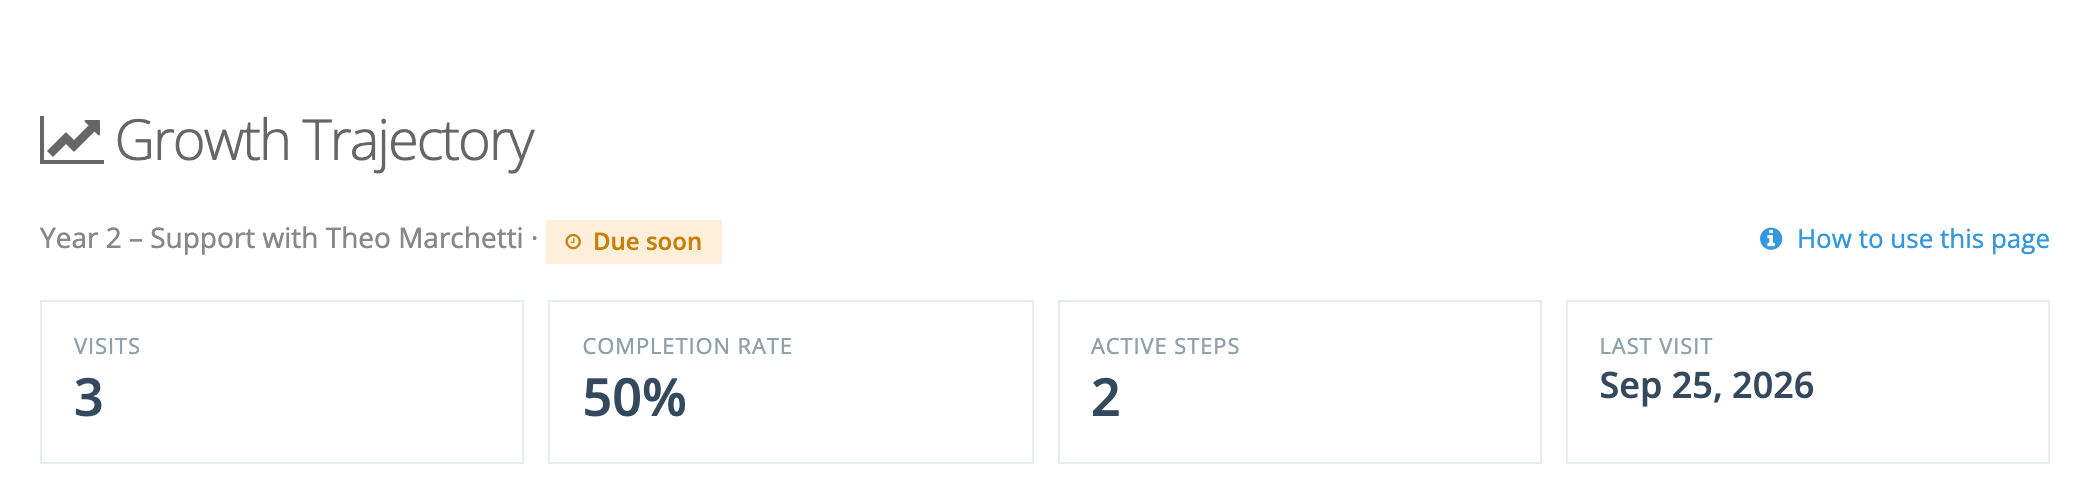
Under the title, a line names the cycle stage (or “Coaching cycle” when none is set), the coach, and the cadence badge: Not started, On track, Due soon, or Overdue. See Setting Up Cycle Stages and Action Step Templates for how cadence is worked out.
| Tile | What it counts |
|---|---|
| Visits | Submitted observations of the teacher by the coach, from the assignment’s Start Date through its completion date. With no start date, every submitted visit counts. |
| Completion rate | Completed steps divided by completed steps plus steps the coach deferred to a date. Open steps and steps deferred automatically when the assignment was completed are left out. Shows a dash until a step resolves. |
| Active steps | Action steps still open. |
| Last visit | The date of the most recent submitted visit, or “No visits yet”. |
Beginning vs. current
Section titled “Beginning vs. current”This panel compares two months: At the start, the earliest month with a submitted visit by this coach to this teacher or a new action step, and Now, the latest such month. Each column shows its month under the heading. The panel looks at all of this coach’s visits with the teacher, so when the pair worked together before the assignment’s Start Date, At the start can be a month from that earlier work.
- Visits that month
- Completion rate: of the steps that resolved that month, the share completed. “No steps resolved yet” means none resolved in that month.
- Top focus area: the focus area on the most action steps created that month, or “None yet”.
An arrow between the columns shows whether visits or completion rate went up or down. Before there is enough activity, the panel reads “Not enough cycle activity yet to compare the start and now.”
Visit frequency and completion rate
Section titled “Visit frequency and completion rate”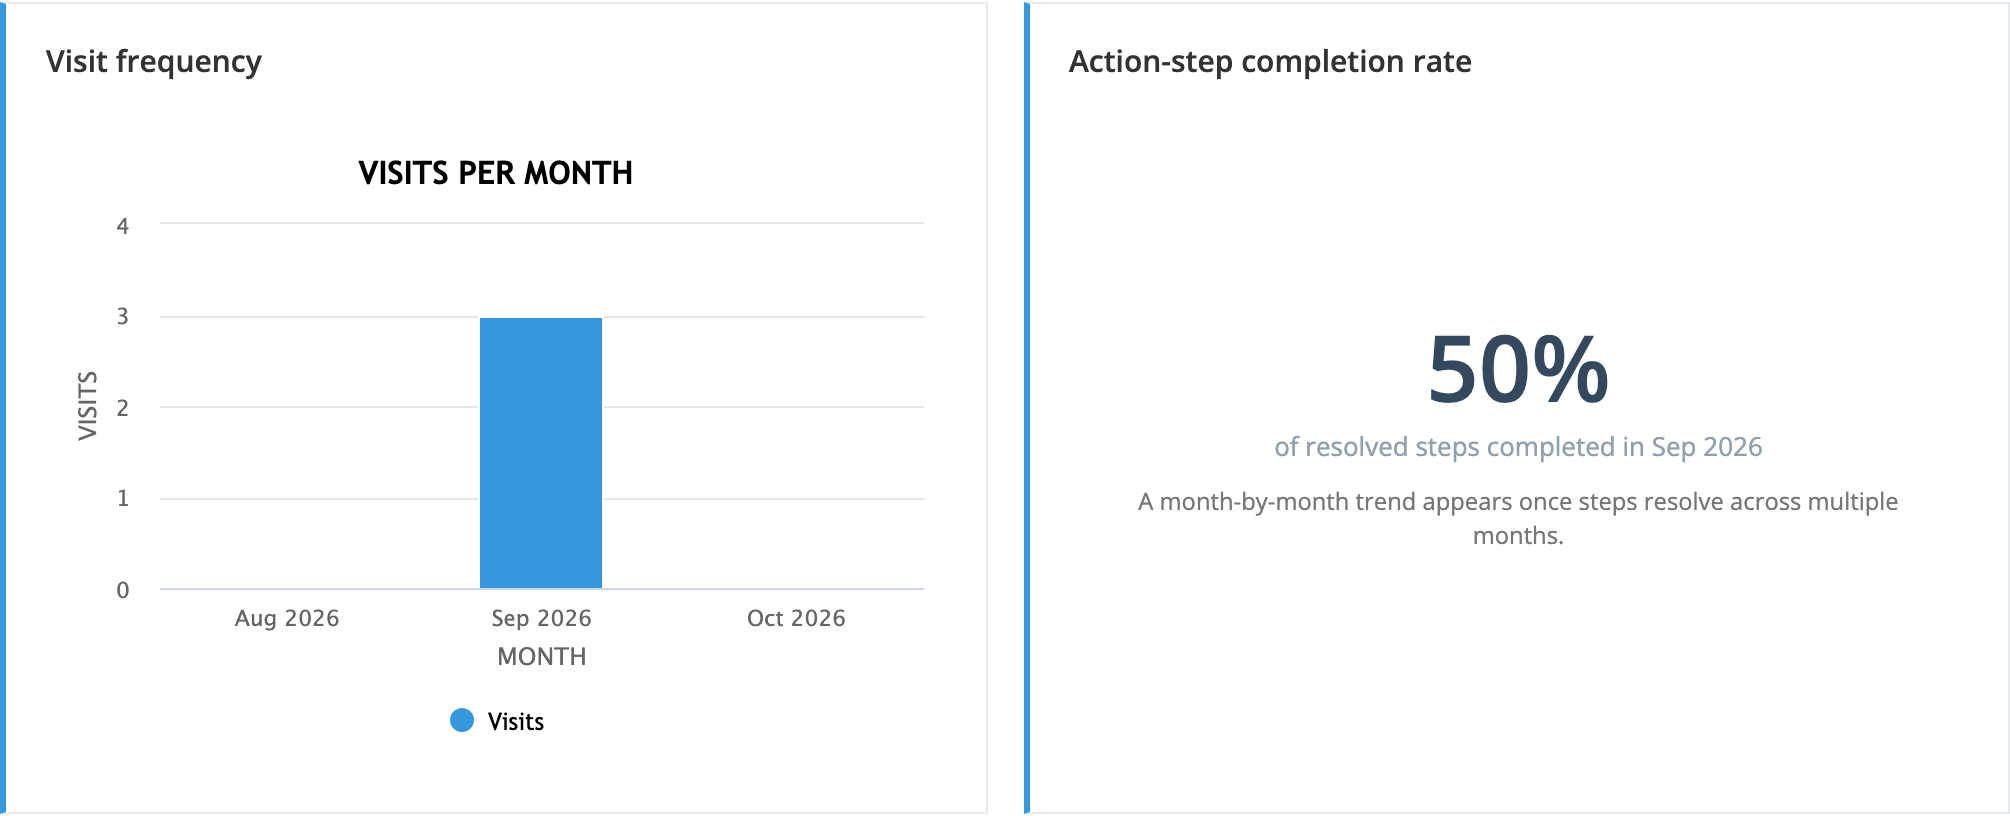
- Visit frequency is a column chart, Visits per month, from the start date (or the first visit) through the completion date or today. A month with no visits shows as an empty column, so a gap in the coaching rhythm stands out. Compare it with the visit interval the teacher’s cycle stage expects. Before any visit, the panel reads “No visits recorded for this cycle yet.”
- Action-step completion rate groups resolved steps by the month they were completed or deferred. Once steps have resolved in two or more months, it becomes a line chart, Completion rate by month. With one month, it shows a single percentage, such as “50% of resolved steps completed in Sep 2026”. Before any step resolves, it reads “No action steps have resolved yet.”
Both charts have a matching data table for screen readers.
Focus-area emphasis
Section titled “Focus-area emphasis”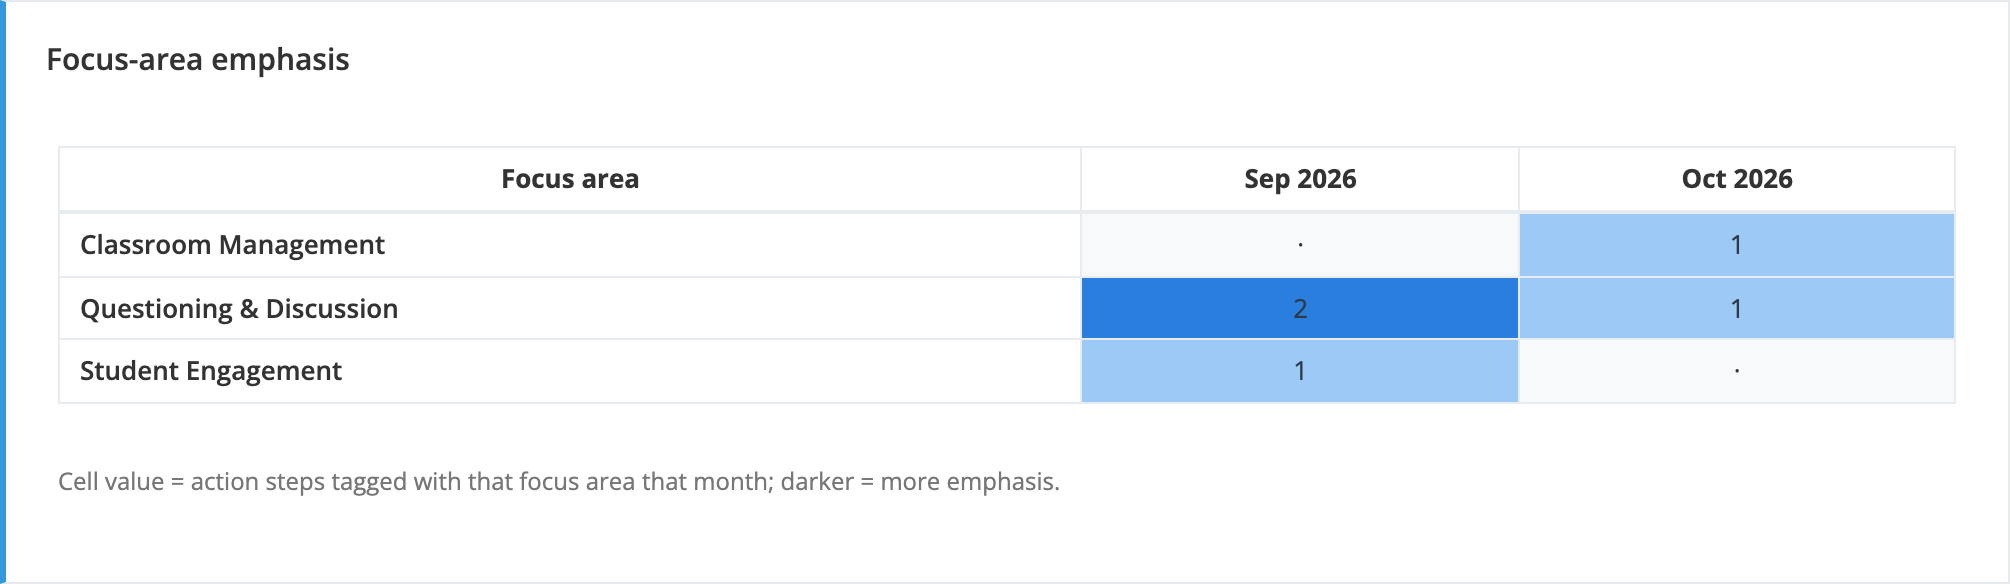
This panel counts action steps by focus area, using the month each step was created. Only tags marked as focus areas count.
- Two or more months: a heatmap with one row per focus area and one column per month. Each cell holds the number of steps tagged with that focus area that month, and darker cells mean more emphasis. A dot marks a month with none.
- One month: a bar list of steps per focus area for that month.
- No tagged steps: “No focus-area tags on this cycle’s action steps yet.”
Tag action steps with focus areas as you assign them so this panel has something to show. See Action Steps.
Using it in a coaching conversation
Section titled “Using it in a coaching conversation”- Before a mid-year check-in, open the page with the teacher and start from Beginning vs. current. It shows where the cycle started and where it is now in three rows.
- When completion is low, look at whether steps are being deferred rather than completed. A string of deferrals often means the steps are too large; break the next one into something the teacher can try by the next visit.
- When the heatmap stays on one row, decide together whether that focus area still needs the time or whether the teacher is ready to move on.
- When visit columns have gaps, plan the next visit before you leave the conversation.